Recording, preparing and merging material is covered here as well
Further down you will find more than analysis tools: Section 9 collects applications for recording audio and video, for matching the loudness of stimuli, for segmenting, converting and separating tracks, and for merging several data sources onto a single time axis. Section 10 contains statistical helpers
To search across all 112 applications, use your browser search: Ctrl + F (Windows) or Cmd + F (Mac), then type in something like “formant”, “hand”, “kappa” or “roughness”.
Contents: what you will find in which section
Sections 1 to 11 present the applications. From Section 12 onwards you will find the workflow, the quick selection guide, the methodological assessment, data security, citation advice and references.
1Sound: audio signal analysis
20 applications: timbre, pitch, tempo, loudness, formants, roughness, room acoustics.
2Sound with AI
15 applications: emotion, genre, instrument, phonemes, intonation – estimated with models.
3Editing and synthesising sound
17 applications: denoising, separating, stretching, morphing, resynthesising – for stimulus preparation.
4Body and posture
3 applications: markerless pose tracking from ordinary mp4 video.
5Hands, face and gaze
6 applications: finger movement, facial expression, facial muscles.
6Movement in the video image
3 applications: quantity of motion, micro-movement, point tracking.
7Emotion and physiology
4 applications: valence and arousal, heartbeat, EEG, eye tracking.
8Visualising and analysing
6 applications: checking tracking data, computing kinematics, displaying avatars.
9Recording and preparing material
13 applications: recording, normalising, segmenting, converting, synchronising.
10Statistical helpers
15 applications, each with its typical pitfalls.
11Demos to explore
10 finished project examples as inspiration for your own research questions.
12A project in six steps
From recording to analysis – and the mistakes beginners make most often.
13Quick selection
Research question → suitable tool → section number.
14Methodological assessment
What these methods can do, what they cannot do, and where typical errors arise.
15Computing time and browser
Why an analysis takes different amounts of time – and which settings help.
16Data security and research practice
What runs locally, what this means for GDPR and ethics, and what you should check case by case.
17Your own projects at the Motion-Emotion-Lab
Starter projects, demo audio and contact.
18Citation, licence and acknowledgements
How to cite the tool and the underlying method correctly.
19References from the SInES lab
Work by the SInES team in which these tools were developed and applied.
1 · Sound: audio signal analysis of mp3 and wav 20 applications
These tools turn an audio file into series of numbers. Each feature describes a different aspect of the sound: level, brightness, noise content, timbre, harmonic structure or rhythm. Inside the applications themselves every feature is explained, including its value range and meaning. Almost all of them support batch processing.
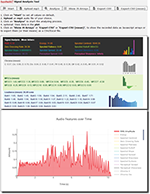
Signal Analysis Tool Istandard entry point
The classic of sound analysis. Among the time-resolved outputs are RMS amplitude, energy, spectral centroid (perceived “brightness”), zero crossing rate, spectral flatness (tonal vs. noisy), spectral flux, rolloff, spread, skewness and kurtosis, psychoacoustic sharpness after von Bismarck, 13 MFCCs, 12 chroma values, 24 Bark bands and loudness in sone after Zwicker.
Method: Meyda.js based on the Web Audio API; plots with Plotly, optional z-standardisation; noise gate for quiet passages; batch processing.
Input: one or several mp3/wav files
Open app
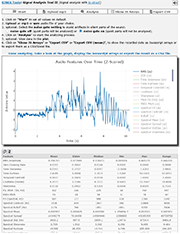
Signal Analysis Tool II
A second, independent feature library with partly different descriptors: tristimulus, irregularity after Jensen and after Krimphoff, spectral crest, inharmonicity, tonality or LPCC. Useful when the results of two libraries are to be checked against each other.
Method: JS-Xtract; FFT, descriptive statistics, z-standardisation.
Input: mp3 or wav
Open app
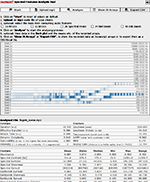
Spectral Features
Timbre analysis with a particularly large number of global measures: duration, effective duration, attack time, loudness, Leq, dynamic complexity, dissonance, spectral complexity, pitch salience, inharmonicity and the ratio of even to odd partials.
Method: Essentia.js; high temporal resolution, z-standardisation, batch processing.
Input: mp3 or wav
Open app
Frequency Bands
How is the energy distributed across the spectrum? Output in 24 Bark bands, complemented by MFCCs, chroma and spectral descriptors – well suited for systematically comparing playing techniques, instruments or recordings.
Method: Essentia.js; band energies and spectral descriptors.
Input: mp3 or wav
Open app
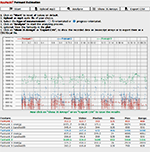
Formant Estimator
Determines the fundamental frequency and the first three formants including amplitude and bandwidth – the standard route to vowel quality, singer’s formant and instrument formants.
Method: formantanalyser.js in real time; z-statistics.
Input: mp3, wav or microphone
Open app

Laplace Transformator
More precise formant tracking (F1 to F4) with adjustable analysis order, plus a display of the signal in the complex s-plane. Interesting for phonetic and signal-theoretical questions.
Method: Laplace transform and linear predictive coding (LPC); selectable LPC order and windowing.
Input: mp3 or wav
Open app

Roughness Estimator
Calculates roughness as a psychoacoustic quantity – the property that makes a narrow second, for instance, sound restless. The direct comparison of several models and their differing results is particularly valuable.
Method: Frequency domain after Vassilakis, Sethares and Plomp-Levelt; time domain after Zwicker, Aures as well as Daniel and Weber; additionally energy in 25 Bark bands.
Input: mp3 or wav
Please note: The models systematically yield different absolute values. For comparisons, always use the same model and name it in the methods section.
Open app

Modulation Power House
Makes recurring patterns visible: vibrato, tremolo, roughness, rhythmic periodicity or syllable rates in speech. Individual modulations can be resynthesised for listening control.
Method: Two-dimensional modulation power spectrum (MPS) via STFT; peak tracking.
Input: mp3 or wav
Open app
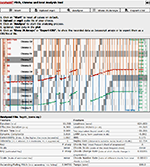
Pitch & Tempo Analyser
Pitch even in polyphonic material, plus tempo in BPM, key, reference pitch and chords. The pitch contour can be exported as a MIDI file or as an audible sine curve – a good way of checking the quality of the analysis by ear.
Method: Essentia.js with beat tracking and chord recognition; plots synchronised to the audio.
Input: mp3 or wav
Open app
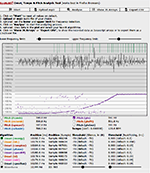
Pitch & Onset Tool
Detects note onsets and pitches and lets you compare several algorithms directly. Ideal for questions of timing: how punctual, how early or late is an entry?
Method: Aubio.js with YIN, YINfft and HFC; visualisation with p5.js.
Input: mp3 or wav
Open app

Clubbernaut (harmonic tension)
Interactive pitchogram across 128 MIDI notes with spectral density, pitch centroid and tonal tension; key and chords are estimated continuously.
Method: clubber.js; real-time analysis with hover readout.
Input: mp3 or wav
Open app

Harmonic Tension Analyser
Models harmonic tension and friction from chroma features – for describing tension curves across a phrase or a whole piece, for example.
Method: Meyda.js chroma with a tension model; canvas visualisation and statistics.
Input: mp3 or wav
Open app

Tempodrom
Determines tempo not purely mathematically but close to perception. The signal is split into 12 frequency bands, rhythmic peaks are located and the result is weighted towards the human preferred rate of roughly 110–120 BPM. The detected groove can be played back as sound.
Method: Multiband decomposition after Klapuri, novelty curves, perceptual weighting.
Input: mp3 or wav
Open app
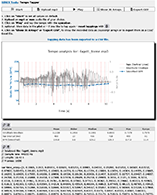
Tempo Tapper
Tap the tempo yourself – with the space bar, optionally along with a running recording. The output consists of inter-onset intervals and a tempo curve with measures of dispersion. Very useful as a human reference against automatic tempo detection.
Method: Manual tapping with descriptive statistics and Plotly curves.
Input: keyboard input, optionally mp3
Open app

dB Analyzer
Calculates sound level and loudness from a recording: dB(A), dB(B), dB(C), LAeq, LUFS, sone, phon, sound pressure in pascal and intensity in W/m².
Method: Conversion from dBFS to dBSPL via manual calibration or bit depth; weighting filters and loudness models.
Input: calibrated wav recording
Please note: Without calibration, absolute levels cannot be interpreted. Relative comparisons within a series of recordings made with an identical chain remain possible.
Open app

Room Acoustics Tool
Determines the acoustic properties of a room from a recorded impulse response: reverberation time T30, early decay time, definition and clarity (D50, C50, C80), speech transmission index STI and more. A built-in auralisation makes the room audible; target profiles show which values are problematic for a practice room or a concert hall.
Method: Analysis according to ISO 3382-1; octave band filtering from 63 Hz to 8 kHz; convolution in real time.
Input: impulse response as wav
Open app

Audio File Analyser
Compact signal analysis with F0, spectral descriptors, MFCCs and rhythmic data – the feature curves can additionally be made audible (sonification).
Method: FFT analysis with Meyda descriptors.
Input: mp3 or wav
Open app

Masking Score Estimator
How strongly does one sound mask another? After loading a target sound and a masker, a masking value is returned. Useful for questions of balance within an ensemble or of the audibility of individual parts.
Method: Comparison of spectral and temporal descriptors with Meyda.js, including 24 Bark bands.
Input: two audio files
Open app
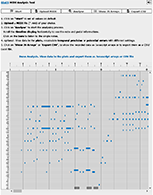
MIDI Analyser
Analyses symbolic music data instead of audio: piano roll, event lists, distributions of pitch, velocity and duration as well as an estimate of harmonic tension.
Method: MIDI parsing with statistical analysis.
Input: MIDI file
Open app
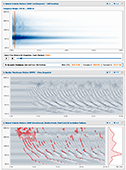
Auditory Image Model (AIM2026)
Traces how the ear processes a signal: from outer-ear transfer via the basilar membrane and the hair cells to the stabilised auditory image. Excellent for explaining pitch perception and timbre in terms of hearing rather than purely spectrally.
Method: Multi-stage auditory model after Patterson, Bleeck and Ives: pre-processing (Glasberg & Moore, ELC, MAF, MAP), gammatone and gammachirp filters, hair cell model after Meddis, strobe finding and stabilised auditory image.
Input: mp3 or wav
Open app
2 · Sound with AI: emotion, genre, instruments, phonemes 15 applications
These tools use trained neural networks. They do not return measurements but probabilities for categories. That is very useful for exploratory questions, but it calls for critical interpretation: a model recognises patterns in its training data, not an objective truth about the recording at hand. The models run locally on your computer.

Speech Emotion Classifier (CLAP)
Detects emotional cues in speech or singing over time – tension, nervousness, hesitation or joy, for example. The curves can be listened to in sync with the audio and saved, either time-resolved or as summary values for the whole recording.
Method: CLAP model (contrastive language-audio pretraining) applied zero-shot, i.e. without any specific fine-tuning.
Input: mp3 or wav
Open app

Instrument & Ensemble Recognizer (CLAP)
Recognises instruments, ensemble types and musical textures over time, with ready-made profiles for orchestra, jazz or rock.
Method: CLAP model in zero-shot classification.
Input: mp3 or wav
Open app

Gender/Speech Emotion Estimator
Estimates eight emotion categories (neutral, happy, sad, calm, angry, fearful, surprised, disgusted) as well as a voice category, each of them time-resolved.
Method: transformers.js with wav2vec2 and ONNX models.
Input: mp3 or wav
Please note: Automatic person categories such as gender or age are error-prone and may contain systematic bias. In academic work, always label them as model estimates, never as a property of the person.
Open app

Speech Emotion Estimator
Emotion classification of spoken language with simultaneous display of 53 acoustic features, among them the fundamental frequency and the formants F1 and F2. This makes it possible to check which acoustic changes underlie a classification.
Method: WebSpeechAnalyzer.js in combination with ml5.js.
Input: mp3 or wav
Open app

Phoneme Recognizer
Recognises individual speech sounds in the IPA alphabet and locates them on a time axis – with statistics on frequency and duration. Useful for questions of text intelligibility in singing or for detailed phonetic work.
Method: wav2vec2 model (lv-60-espeak) via transformers.js.
Input: mp3 or wav
Open app

Sound Classifier
Automatically names hundreds of sound events and locates them in time – from instruments and voices to environmental sounds. Practical for screening long recordings or documenting disturbing noises.
Method: Audio spectrogram transformer (AST) based on the AudioSet ontology.
Input: mp3 or wav
Open app
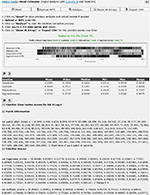
Mood Estimator
Estimates the mood of a piece of music in categories such as happy, sad, aggressive, relaxed or “party”, time-resolved across segments.
Method: MusiCNN models via Essentia.js and TensorFlow.js.
Input: mp3 or wav
Please note: The estimate describes the mood expressed in the signal as defined by the training data – not the experience of any particular listener.
Open app
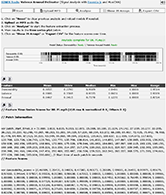
Valence Arousal Estimator
The same question on continuous axes: valence (pleasant–unpleasant) and arousal (calm–excited), displayed as a heatmap across time segments.
Method: MusiCNN via Essentia.js and TensorFlow.js.
Input: mp3 or wav
Open app
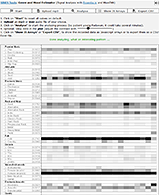
Genre Estimator
Automatic genre assignment for a piece of music with probabilities for each category – useful for pre-sorting large collections.
Method: MusiCNN via Essentia.js and TensorFlow.js.
Input: mp3 or wav
Open app
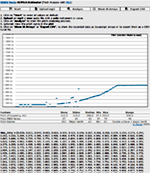
AI Pitch Estimator (CREPE)
Highly accurate fundamental frequency tracking for solo voices and single instruments on a logarithmic grid, with statistics across the entire contour.
Method: CREPE model via ml5.js.
Input: mp3, wav or microphone
Open app
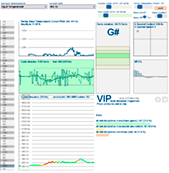
Violin Intonation (VIP)
Checks intonation while playing in real time: deviation in cents from equal, Pythagorean or just intonation, plus timbre measures (MFCC, sharpness, spread).
Method: CREPE pitch detection with historical temperaments and selectable reference pitch.
Input: microphone or audio file
Open app
Viola Intonation (VIP)
The same intonation analysis, adapted to the range and the strings of the viola.
Method: CREPE pitch detection with comparison of temperaments.
Input: microphone or audio file
Open app
Cello Intonation (VIP)
Intonation practice for the cello with real-time feedback on deviation in cents and on timbre.
Method: CREPE pitch detection with comparison of temperaments.
Input: microphone or audio file
Open app
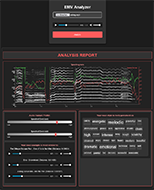
Extreme Metal Vocals (EMV)
Positions your own voice in relation to metal singing techniques – a vivid teaching example for the feature profiles of extreme vocal techniques.
Method: Essentia.js with WASM; spectral contrast, centroid and further descriptors.
Input: microphone or audio file
Open app

Image Batch Analyser
Opens up image collections automatically: object recognition, image captions, instrument recognition and facial features. Useful for analysing historical image holdings or stimulus material, for instance.
Method: COCO-SSD for objects, ViT-GPT2 for captions, CLIP for instruments.
Input: several image files
Please note: Automatic estimates of age, gender and expression from images are model estimates with known biases and call for ethical reflection.
Open app
3 · Editing, separating and synthesising sound 17 applications
Analysis is only one half of the work. Controlled listening experiments need material that differs in exactly one property – and that is what these tools are for: shifting pitch without moving the formants, removing noise, detuning partials, transferring vibrato, separating tracks.

Spectral Editor (denoising)
Removes unwanted noise from a recording in a targeted way: in the logarithmic sonagram, regions can be selected and edited with a lasso, a rectangle or a horizontal line. The fastest way to obtain usable stimulus material from a less than perfect recording.
Method: STFT-based spectral editing with interactive selection.
Input: mp3 or wav
Open app

Harmonic/Percussive Separator
Splits a signal into tonal and noise-like components. This makes it possible to study attack noises, bow changes or striking components separately from the tone – both parts can be saved as sound and as data.
Method: Spectral median filtering after FitzGerald (2010).
Input: mp3 or wav
Open app

Harmonicity Analyser (HNR)
Separates periodic from noise-like signal components and calculates the harmonics-to-noise ratio in dB – an established measure of voice quality and tone production.
Method: STFT masking with YIN-based fundamental frequency estimation.
Input: mp3 or wav
Open app

Harmonic Frequency Extractor
Filters out or suppresses the fundamental and its multiples in a targeted way – with adjustable bandwidth (Q) and filter inversion. Well suited for making the contribution of individual partials audible.
Method: STFT-based comb filtering with energy contours.
Input: mp3 or wav
Open app

Modulation Transfer (vibrato, jitter, shimmer)
Measures frequency and amplitude modulation – vibrato rate and extent, tremolo, jitter and shimmer – and transfers these modulations to other sounds. A powerful tool for voice research and for controlled listening experiments.
Method: Modulation analysis with stability measures and resynthesis.
Input: mp3 or wav
Open app

Time Stretcher
Changes the duration of a recording by a factor of 0.1 to 50 without shifting the pitch – even at very large stretch factors without the usual artefacts.
Method: Phase-coherent spectral processing (phase vocoder).
Input: mp3 or wav
Open app

Pitch & Formant Shifter
Shifts pitch and formants independently of one another while the duration stays the same. Voices and instrument sounds can thus be varied in a controlled way without changing the rate of speech.
Method: F0 tracking via harmonic product spectrum and phase vocoder.
Input: mp3 or wav
Open app

Formant Shifter
Shifts and reshapes the spectral envelope only – for emphasising the singer’s formant or varying vowel colours systematically, for instance.
Method: Cepstral envelope extraction with adjustable shift, contrast and spectral tilt.
Input: mp3 or wav
Open app

Spectral Warper
Moves partials from harmonic into inharmonic relationships – the practical implementation of Sethares’ claim that consonance depends on the spectrum and not on the interval alone.
Method: YIN-based pitch detection with spectral stretching/compression after Sethares.
Input: mp3 or wav
Open app

Squeeze & Stretch Partials
Turns consonances into dissonances and vice versa: additive synthesis with manually detuned partials. A classic demonstration for the lecture hall.
Method: Additive sine synthesis after Sethares.
Input: parameter input
Open app

Spectral Resynthesizer
Extracts the strongest partials of a sound and rebuilds it with a selectable number of sine oscillators. A vivid way of showing how many partials are needed for a recognisable sound.
Method: Additive resynthesis with peak tracking and envelope smoothing.
Input: mp3 or wav
Open app

Spectral Cross-Synthesizer
Transfers the timbre of a target sound onto a source sound – the classic cross-synthesis, speech through an instrument, for example.
Method: FFT and cepstrum analysis with envelope transfer in the frequency domain.
Input: two audio files
Open app

Spectral Morpher
Blends two sounds continuously into one another, with time stretching, pitch tracking and formant correction – for listening experiments with graded intermediate steps.
Method: Phase-coherent time warping with morphing control.
Input: two audio files
Open app

Spectral Stamper
“Stamps” the average spectrum of one file onto another as a filter – for transferring the sonic signature of a room or an instrument, for instance.
Method: STFT with an averaged spectrum as a static filter.
Input: two audio files
Open app

Spectral Gator
Keeps or removes frequency components depending on their level – muting quiet components or, conversely, suppressing loud peaks.
Method: Spectral gating with dB thresholds.
Input: mp3 or wav
Open app

Bark Band Vocoder
Matches two signals to one another across 24 critical bands – the classic vocoder effect, but methodologically most interesting for controlled masking experiments with interfering noise.
Method: Bark band vocoding with envelope following.
Input: two audio files
Open app
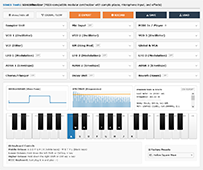
SInESthesizer
Modular Web Audio synthesiser with three oscillators, filter, LFOs, envelopes, ring modulator, sampler, microphone input, MIDI support and effects. Ideal for creating stimuli with precisely defined parameters yourself.
Method: Web Audio API with a dynamic signal flow diagram.
Input: MIDI, samples, microphone
Open app
4 · Body and posture: pose tracking from mp4 3 applications
From an ordinary video, the coordinates of body points are estimated frame by frame – without markers on the body. From these, movement trajectories, joint angles, velocities and posture indices can be calculated. It is important to understand that the tools deliver model-based landmark coordinates, not measurements of forces, joint moments or muscle activity.

2D/3D Pose Tracker (BlazePose)recommended version
The central starting point for studies with a single person. It captures 33 body landmarks – head, shoulder, elbow, wrist, individual hand reference points, pelvis, knee, ankle, heel and forefoot – each in 2D and as a model-based 3D estimate. This allows posture, whole-body coordination, breathing movement of the upper body and movement trajectories during playing to be examined.
Method: BlazePose, frame by frame; automatic or manual frame rate entry.
Input: mp4 showing one person
Please note: The 3D values are an estimate in a camera-related system, not a calibrated laboratory coordinate system. Occlusions and rapid rotations produce outliers.
Open app

2D Multiple Person Pose Tracker (MoveNet)
For ensembles, groups, dance or teaching situations: up to six people simultaneously, 17 body points each in 2D. This makes it possible to address questions of synchrony, alignment within an ensemble or interaction between people.
Method: MoveNet MultiPose; skeleton display and time-referenced export.
Input: mp4 showing up to six people
Please note: No depth information; fingers and fine hand movements are not captured.
Open app
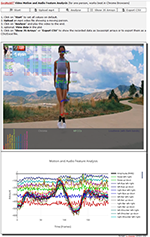
2D/3D Pose Tracker with audio analysisolder version
Older combination of pose tracking and audio analysis in a single pass: 33 landmarks and more than 50 audio features in sync. For new projects, the current pose tracker plus a separate audio analysis, merged along the time axis, is recommended instead.
Method: BlazePose in combination with Meyda.js; real-time mode fast but less accurate, frame mode more accurate but then without audio features.
Input: mp4
Open app
5 · Hands, face and gaze 6 applications
Instrumental technique, embouchure, facial expression and gaze behaviour require finer models than the whole-body skeleton.

2D/3D Hand Tracker (MediaPipe)recommended version
Tracks finger movements, hand shapes and movement trajectories of both hands in detail: 21 landmarks per hand, i.e. up to 42 time series. The central approach for questions of instrumental technique, fingering and position changes, bowing or fine motor skills in rehabilitation.
Method: MediaPipe Hands, frame by frame, in 2D and model-based 3D.
Input: mp4 with one or two visible hands
Please note: Instrument, bow or sleeves can occlude landmarks; in fast passages the left/right assignment may jump. Always check trajectories visually.
Open app
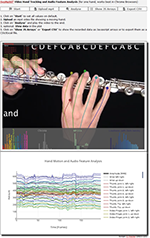
2D/3D Hand Tracker with audio analysisolder version
Both hands with 21 points each, synchronised to more than 50 audio features – the older combined variant, still useful when movement and sound are to be captured in a single pass.
Method: MediaPipe Hands with Meyda.js.
Input: mp4
Open app

2D Face/Body/Hand Tracker (Human.js)
Everything in one pass: body pose, both hands, facial landmarks, gaze direction as well as model-based estimates of age and emotion – in a single, temporally synchronised data set. Well suited to multimodal performance and interaction analyses.
Method: Human.js by Vladmandic, which bundles several models (MoveNet, FaceMesh, Iris); moving averages for smoothing.
Input: mp4 with one clearly visible person
Please note: Broad coverage does not mean the highest accuracy in every single area. Use age and emotion estimates with ethical reflection.
Open app

Facial Expression Analysisrecommended version
Tracks facial expression frame by frame and examines the temporal course of seven expression categories: neutral, happy, sad, angry, surprised, fearful, disgusted.
Method: face-api.js with facial landmarks and emotion probabilities.
Input: mp4 with a clearly visible face
Please note: The model estimates visible patterns of expression. It does not measure inner experience – a face may look concentrated and the experience may still be a joyful one.
Open app

Facial Muscle Tracking
Describes very fine changes in facial expression: 52 parameters for individual facial regions, such as jaw position, lip shape or eyebrows. Particularly relevant for research on singing, wind playing and speech.
Method: MediaPipe Face Landmarker with landmark and blendshape values.
Input: mp4
Please note: Despite its name, this is not a measurement of muscles. Anyone wanting to record muscle activity needs EMG.
Open app
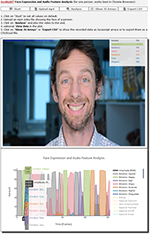
Face Expression Tracker with audio analysisolder version
Older combination of facial expression and audio analysis in the same pass, with seven emotion categories and more than 50 acoustic parameters.
Method: ml5.js for facial expression, Meyda.js for the audio signal, with z-standardised statistics.
Input: mp4
Open app
6 · Global movement and micro-movement in video 3 applications
A skeleton model is not always necessary. Sometimes the question is simply: how much movement is there at all, in which direction and how regularly? These methods also work where pose tracking fails – with unusual perspectives, wide stage shots or heavy occlusion, for example.
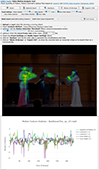
Video Motion Analysis Tool
Quantifies the global movement in a video: quantity of motion, centroid of motion, direction of movement to the left/right and up/down as well as the periodicity of the movement including an estimated movement tempo in BPM. Ideal for dance, ensemble movement and the comparison of entire performances.
Method: OpenCV.js with frame differencing, MOG2 background subtraction and dense optical flow; concepts of RITMO VideoAnalysis after Jensenius (2005); autocorrelation for periodicity.
Input: mp4, ideally with a stable camera
Please note: Camera movement is measured as body movement. Use a tripod.
Open app
Video Motion Amplification Tool
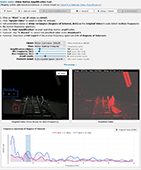
Makes movements and colour changes visible that the naked eye cannot detect: vibrations of an instrument top, fine tremor, breathing movement or the pulse-related blood flow in the face. Within a freely chosen image region, specific frequency ranges can be amplified.
Method: Eulerian video magnification (Wu et al., 2012) with DFT spectrum for determining the frequency.
Input: mp4 and a selected image region
Please note: The method also amplifies image noise, compression artefacts and camera shake.
Open app
Point Tracker
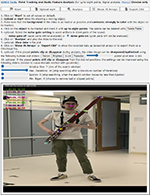
Tracks up to eight self-defined points through a video. The points can be placed anywhere: on the tip of the bow, on the body of the instrument, on a mallet, on an adhesive marker on clothing or on a technical component. The analysis thus remains independent of anatomical models.
Method: Kanade-Lucas-Tomasi feature tracking (KLT) with OpenCV.js.
Input: mp4 and manually placed starting points
Please note: Points are lost in the case of occlusion, motion blur or strong changes in contrast – simply set them again.
Open app
7 · Emotion and psychophysiological responses 4 applications
Emotion can be captured in three ways: subjectively through self-report, expressively through facial expression and voice, and physiologically through bodily signals. The three approaches frequently disagree – and that is precisely where their scientific interest lies. A strong piece of work combines at least two of them.
Emotion Analysis (valence – arousal)
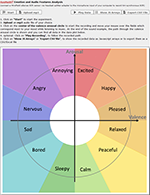
Records the experience during listening continuously: the listener moves the mouse within a plane between pleasant and unpleasant (valence) and between calm and excited (arousal). In parallel, skin conductance, temperature and respiration can be recorded via Mindfield eSense sensors, together with the audio features of the stimulus – all on a common time axis.
Method: Two-dimensional circumplex model (Russell, 1980) with eSense sensor data and audio analysis via Meyda.js.
Input: mp3 stimulus, mouse movement, optionally sensor data
Please note: Valence and arousal are two model axes and not a complete description of complex emotions such as being moved or nostalgia.
Open app
Heartbeat Tracker
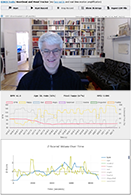
Estimates heart rate and pulse wave contactlessly from the webcam image – without a chest strap or finger clip. The pulse curve can be viewed together with more than 50 audio features, for instance to study tension before a difficult entry.
Method: Remote photoplethysmography (rPPG): minute colour changes in an automatically determined facial region are analysed as a pulse-related signal, and the frequency is determined by FFT.
Input: webcam with light as constant as possible
Please note: No substitute for an ECG or a validated measuring device. Head movement and changes in lighting create strong artefacts – intended for pilot studies and teaching.
Open app
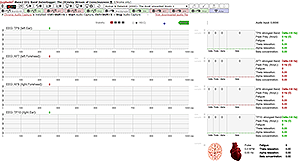
Muse 2 EEG Datalogger
Records brain activity with a commercially available headband and displays it across several frequency bands. It also contains a synthesiser that makes the signals audible.
Method: Four-channel EEG via Web Bluetooth; display with Plotly, audio-synchronised exploration.
Input: Muse S or Muse 2 headband
Please note: Consumer EEG with few electrodes. Suitable for orientation and teaching, not for clinical or neurophysiologically fine-grained statements.
Open app

Eye Tracker
Captures gaze behaviour with an ordinary webcam: where do musicians look when sight-reading? The results are heatmaps and gaze paths over an image you upload yourself.
Method: WebGazer.js with a 29-point calibration.
Input: webcam and stimulus image
Please note: Considerably less accurate than a laboratory eye tracker; the calibration must be done carefully and the head position must remain stable.
Open app
8 · Visualising and analysing kinematics 6 applications
After tracking, all you have at first are coordinates. The data analyzers turn them into interpretable quantities – and they are at the same time the most important tool for quality control: only once skeleton and video visibly match is it worth doing any calculations.
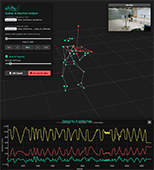
3D Data Analyzerrecommended version
Visualises, smooths, edits and analyses three-dimensional tracking and motion capture data. Trajectories, joint angles, velocity, acceleration and distance covered are calculated. Movements can additionally be transferred onto freely selectable 3D avatars and saved as an animated file. Two special functions are particularly useful: Center Root removes locomotion through space and shows only the movement of the body itself, Reconstruct Space does the opposite.
Method: Three.js for the 3D display, Plotly for time series; smoothing with the 1€ filter (Casiez et al., 2012); principal component analysis for identifying movement synergies; movement features following the MATLAB MoCap Toolbox (Burger & Toiviainen, 2013) and Bigand et al. (2021).
Input: Qualisys TSV, BlazePose CSV, MediaPipe CSV, optionally mp4 and a GLB avatar
Open app
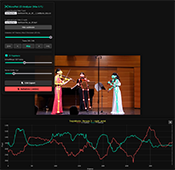
2D Data Analyzerrecommended version
The same for two-dimensional data, with support for up to six people at once. Pose, hand, face and point data can be overlaid on the original video, checked and analysed together. An OpenPose export and a face transfer across 68 landmarks are also available.
Method: HTML5 canvas and Plotly; kinematics, 1€ filter, PCA; features following the MoCap Toolbox (Burger & Toiviainen, 2013) and RITMO VideoAnalysis (Jensenius, 2005).
Input: tracking CSV, optionally hands, face, points and mp4
Open app

3D Pose Tracking Visualiser (avatar)
Plays back BlazePose data as a 3D avatar and stick figure in sync with the video. Five posture indicators can be read off directly: shoulder alignment, neck inclination, bow arm position, lateral trunk inclination and forward lean. This makes the tool the most illustrative one for questions of posture in instrumental teaching.
Method: A-Frame and Three.js; adjustable bone mapping and rotation offsets.
Input: BlazePose data and the corresponding mp4
Please note: The indicators are derived kinematic quantities – they describe posture, they do not diagnose anything.
Open app

2D Pose/Hand/Face Tracking Visualizer
Matches the Human.js tracker: video and tracking data are displayed as an overlay, and the transparency of the video is freely adjustable. Joint angles, angular velocities, accelerations and distances are calculated automatically for eight central joints. The blend of video and stick figure can be recorded as a video – good for presentations and for feedback in teaching.
Method: Canvas overlay with automatic kinematic computation.
Input: mp4 and a data file from the Human.js tracker
Open app

3D Pose Tracking Visualiser (stick figure)older version
Stick figure animation from BlazePose data with automatic correlation between movement and more than 50 audio features (Pearson), including a statistics report and Excel export.
Method: Synchronised playback with correlation analysis.
Input: BlazePose data and mp4
Open app

3D Hand Tracking Visualizer (stick hands)older version
The same for hand data: 42 keypoints in sync with video and audio features, with movement traces and kinematic statistics.
Method: Synchronised playback with Pearson correlation.
Input: hand tracking data and mp4
Open app
9 · Recording, preparing and merging material 13 applications
The least spectacular part of a project decides its quality: clean recordings, matched stimuli, a common time axis and files in a format that the analysis software can actually read.

Audio Recorder
Creates scientifically usable recordings directly in the browser: with a calibration aid for level measurements, a real-time spectrogram, selectable sampling rate and bit depth (up to 32-bit float) as well as an editor for cutting and normalising.
Method: Web Audio API with dBSPL calibration; export as wav.
Input: microphone
Open app
Video Recorder and Editor
Records video from a webcam or the screen, or loads existing videos, and cuts and crops them frame-accurately – the fastest way of preparing stimulus material.
Method: Client-side recording and FFmpeg in the browser.
Input: webcam, screen or video file
Open app
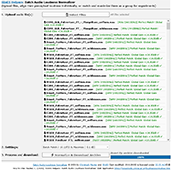
Batch Audio Loudness Normalizer
Indispensable before any listening experiment: match several stimuli in perceived loudness so that differences in judgement are not simply differences in level.
Method: LUFS normalisation according to EBU R 128 and peak level adjustment (dBFS) with FFmpeg, locally in the browser.
Input: several audio files
Open app

Sound Segmenter
Automatically splits a long recording into individual notes or events – including pitch detection. Saves a great deal of manual work with scale series or single-note recordings.
Method: Segmentation via dBFS and SPL thresholds with pitch detection via ml5.js.
Input: audio file
Open app
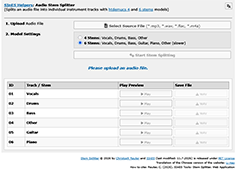
Audio Stem Splitter
Splits a mix into individual tracks: vocals, drums, bass, guitar, piano and residual. This makes it possible to analyse individual parts from recordings for which no separate tracks exist.
Method: ONNX Runtime Web with htdemucs v4 (4- or 6-stem mode), entirely local.
Input: audio file
Please note: Source separation produces artefacts. Interpret fine spectral measurements on separated tracks with caution.
Open app

Batch Audio Channel Separator
Splits stereo and multichannel files into individual mono tracks – for multi-microphone recordings or measurement series with several positions, for example.
Method: FFmpeg in the browser, batch processing.
Input: wav or mp3
Open app

Movie to MP3/MP4 converter
Converts mov, avi, mpg, webm and similar formats into standardised mp4 or mp3 – the precondition for the tracking tools to read a video reliably.
Method: FFmpeg in the browser with a progress display.
Input: video file
Open app
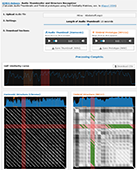
Audio Thumbnailer
Derives the musical structure of a piece from self-similarity matrices and determines the most characteristic excerpt (the “thumbnail”) – helpful when selecting representative stimuli.
Method: Chroma and MFCC features via Meyda.js, self-similarity matrix with diagonal smoothing after Paulus and Klapuri (2009).
Input: mp3 or wav
Open app

Excel Synchroniser
The key to multimodal analysis: brings several tables of different length and sampling rate onto a common time axis – movement at 30 Hz, audio at 43 Hz and skin conductance at 5 Hz, for instance.
Method: Alignment to the longest or shortest table with numerical interpolation.
Input: Excel or CSV
Please note: Interpolation does not create new information. The effective temporal resolution remains that of the slowest source.
Open app

Excel Sorter
Restructures tables according to periodic patterns: keep, remove or move every nth row or column to the end. Practical for downsampling tracking data.
Method: Pattern-based manipulation of rows and columns.
Input: Excel or CSV
Open app

CSV format converter
Converts between the European format (semicolon, decimal comma) and the American one (comma, decimal point). The most frequent stumbling block when importing into R, SPSS or Excel.
Method: Automatic type detection and format conversion.
Input: Excel or CSV
Open app
Excel to JS Array
Converts tables into ready-made JavaScript arrays – for your own interactive displays and web demos.
Method: Column names are cleaned up into valid variable names.
Input: Excel or CSV
Open app

Perceptual Color Comparator
Calculates perceived colour differences (ΔE according to CIELAB 76, 94, 2000) – useful for colour coding in graphics, questions of accessibility and studies on colour-sound associations.
Method: CIELAB distance formulas with guidance on interpretation.
Input: HEX or RGB values
Open app
10 · Statistical helpers – explained 15 applications
Fifteen tools for correlation, group comparison, reliability, clustering, smoothing and display – each with its field of application and its typical pitfall.

Time Series Analysercentral for these data
The methodologically most important statistical tool for movement, sound and physiological data: it looks for relationships between time series and takes temporal lags into account. A matrix scan checks all pairs of variables against each other.
Method: Cross-correlation with lag analysis, autocorrelation, moving averages, detrending (differencing).
Input: Excel or CSV
When to use: Whenever two quantities measured over time are compared – arm velocity and sound level, for example. The lag indicates which quantity precedes the other; in substantive terms that is often more interesting than the size of the correlation itself.
Statistical pitfall: Time series are autocorrelated: successive values resemble one another, which makes the effective sample size far smaller than the number of frames. An r of 0.6 between two smoothed curves can arise purely from shared trends. Detrend before interpreting, and do not calculate significance using n = number of frames.
Open app

Columns Correlator
Correlations with the necessary checks instead of a bare number: alongside Pearson and Spearman, normality, outliers, homogeneity of variance and the correction for multiple tests are computed at the same time.
Method: Pearson r and Spearman ρ; Shapiro-Wilk test for normality, Grubbs test for outliers, Breusch-Pagan test for heteroscedasticity, Bonferroni correction; scatter plots and heatmaps.
Input: Excel or CSV
When to use: For cross-sectional data with one row per person, note or recording. Pearson assumes a linear relationship and approximately normally distributed values; with rank data, outliers or monotonic non-linear relationships, Spearman is the more honest choice.
Statistical pitfall: A feature matrix of 50 audio descriptors yields 1225 correlations; around 61 of them become significant by chance at α = 0.05. Correction is not a formality here. Bonferroni is strict – with many tests, the FDR correction after Benjamini and Hochberg (1995) is usually more appropriate.
Open app

t-Tester
Tests differences in means between two groups – with t value, p value and the effect size Cohen’s d, including an automatic check of the assumptions.
Method: t-test for independent samples; Shapiro-Wilk test for normality, Levene test for homogeneity of variance; Cohen’s d.
Input: Excel or CSV
When to use: Two groups, one metric dependent variable. With unequal variances the Welch version is the default case; with small, skewed samples a rank test (Mann-Whitney U) is more robust.
Statistical pitfall: The p value grows with the sample size, the effect size does not. Publications should report d or η² and a confidence interval – the p value alone says little about practical relevance.
Open app

SupANOVA (ANOVA and PCA)
Compares more than two groups and at the same time reduces the structure of many features: the ANOVA identifies the most discriminating variables via F values, while the principal component analysis shows the position of the groups in 2D or 3D spaces with convex hulls. Data points can be linked to sound files and listened to directly.
Method: One-way analysis of variance with F values and feature selection; PCA for dimensionality reduction.
Input: Excel or CSV
When to use: Typical for comparisons of instruments, playing techniques or conditions with many audio descriptors. The PCA answers the question of how many mutually independent dimensions the 50 features actually contain – usually surprisingly few.
Statistical pitfall: Running a PCA first and then testing the same data for group differences with an ANOVA is circular if the choice of components was influenced by the groups. Fix the components before testing or label the procedure as exploratory. Standardise before the PCA, otherwise variables with a large scale dominate.
Open app

Interrater Calculator
Calculates the agreement between several raters – the basis of any work with ratings, annotations or video coding.
Method: Fleiss’ kappa, Krippendorff’s alpha (nominal) and Cronbach’s alpha with p values, z values and 95% confidence intervals; coincidence matrix.
Input: Excel or CSV
When to use: Fleiss’ kappa for several raters and nominal categories, Krippendorff’s alpha also with missing values, Cronbach’s alpha for the internal consistency of a scale. For metric ratings by several raters, the intraclass correlation is customary in addition.
Statistical pitfall: Cronbach’s alpha measures internal consistency, not unidimensionality, and rises simply through having more items. Kappa comes out low with very unevenly occupied categories even though agreement is high – report the marginal distributions as well.
Open app

ClusterBuster (k-means)
Finds groups in data that are not known in advance – types of playing, sound families or movement patterns, for example. The elbow method helps in choosing the number of clusters, and an outlier check based on z values keeps the solution stable.
Method: k-means with automatic normalisation, elbow criterion (WCSS), 2D and 3D scatter plots.
Input: Excel or CSV
When to use: Exploratory, when structure is suspected but no group membership is known.
Statistical pitfall: k-means always finds clusters, even in random data, favours spherical groups of similar size and depends on the starting initialisation. Check the solution with several starting values, standardise the variables beforehand and justify the structure found in substantive rather than merely numerical terms.
Open app

Gaussian Mixture Model
The softer alternative to k-means: instead of a hard assignment, a probability of membership in several normal distributions is estimated for each data point, with weights, means and variances.
Method: Gaussian mixture models for two columns with density curves and scatter plots.
Input: Excel or CSV
When to use: When groups overlap or scatter differently – with intonation distributions around several target pitches, for example.
Statistical pitfall: The number of components has to be justified; information criteria (BIC) are better suited to this than mere visual inspection.
Open app

Similarity Sorter
Sorts all rows of a table by how similar they are to a reference row you choose – for instance: which recording comes closest to the ideal sound?
Method: Cosine similarity for multidimensional data, inverse distance for a single column; columns can be included and excluded.
Input: Excel or CSV
When to use: For similarity rankings across many descriptors, for example when comparing instruments or interpretations.
Statistical pitfall: Without standardisation, features with a large numerical scale dominate the result. The choice of the columns included is a substantive decision and belongs in the methods section.
Open app
Z-Transformer
Brings all numerical columns to a mean of 0 and a standard deviation of 1. The original values are retained, the z values are added as new columns.
Method: Column-wise z-standardisation.
Input: Excel or CSV
When to use: Before any procedure that forms distances or weights across variables with different scales: PCA, cluster analysis, similarity measures, multiple regression.
Statistical pitfall: Standardisation does not change the shape of a distribution: skewness and outliers remain. For comparisons between groups it must be decided whether standardisation takes place within or across all groups – this can reverse results.
Open app
Moving Averager
Smooths noisy time series with a moving average, with a freely selectable window width.
Method: Centred moving average with an MA_ prefix in the output.
Input: Excel or CSV
When to use: To dampen tracking jitter before velocity or acceleration is calculated – differentiation amplifies noise considerably.
Statistical pitfall: Smoothing increases autocorrelation and hence apparent correlations between curves. Always report the window width and keep it constant across comparisons. For kinematics, a Savitzky-Golay or Butterworth filter is usually the better choice because it attenuates amplitudes less.
Open app

Progression Charter
Displays courses across several phases – rest, preparation, performance and recovery, for example – with means or medians per phase and trend lines.
Method: Aggregation by category with trend analysis.
Input: Excel or CSV
When to use: Typical for skin conductance, heart rate or self-report across the phases of an experiment.
Statistical pitfall: With repeated measurements on the same people, simple group comparisons are not admissible; this calls for a repeated-measures ANOVA or mixed models with a random effect for the person.
Open app

Excel Boxplotter
Shows distributions instead of means only: box plots, violin plots and radar charts, optionally with the individual values superimposed.
Method: Quartile display, kernel density, radar charts, optional z transformation and grouping.
Input: Excel or CSV
When to use: For any presentation of results with a group comparison. Plotting the individual points as well is standard today and reveals bimodal distributions that a bar chart conceals.
Statistical pitfall: Radar charts across many descriptors look impressive but distort distances; the order of the axes determines the shape.
Open app

Heatmapper
Displays matrices of numbers in colour code – particularly suitable for correlation matrices across many features.
Method: Colour scales with adjustable minimum and maximum, automatic contrast adjustment of the type.
Input: Excel or CSV
When to use: For an overview of large feature matrices before individual relationships are examined in a targeted way.
Statistical pitfall: The colour scale determines the impression. For correlations, use a diverging scale symmetrical around zero and always state the limits.
Open app

Excel Visualiser
Creates charts from tables: bar, scatter, bubble, 3D surface and density plots. The interactive HTML export makes it possible to link data points to sound files – audible statistics for talks.
Method: Plotly-based charts with z transformation and logarithmic scaling.
Input: Excel or CSV
When to use: For quick exploratory screening and for presentations.
Statistical pitfall: Exploratory graphics are not hypothesis tests. Whatever catches the eye while browsing many plots has to be verified on new data.
Open app
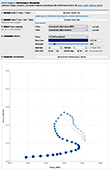
Performance Wormhole
Displays tempo and dynamics as a joint movement trace – the performance worm after Dixon, Goebl and Widmer (2002), the established image for comparing interpretations. Other pairs of features can be displayed in the same way.
Method: Automatic determination of tempo and loudness, smoothing, logarithmic scaling, synchronous playback.
Input: audio or data file
When to use: For comparing interpretations and for teaching: two recordings of the same piece become immediately distinguishable in the worm image.
Statistical pitfall: The shape depends strongly on the smoothing; use identical settings for comparisons.
Open app
11 · Demos to explore 10 demos
These finished applications show how movement, sound and emotion were brought together in concrete projects of the SInES lab. They are well suited to developing a research question of your own – and to seeing what ultimately becomes of the raw data.

MAD – Motion & Audio Feature Display
Links body movements in saxophone playing to audio features such as pitch, spectral centroid and MFCCs; relationships become visible as correlations.
Reuter, C., Bertsch, M., Czedik-Eysenberg, I., Cui, A.-X., Roos, M., Ambros, S., Jewanski, J., Eder, M., Mühlhans, J., Klooss, F., Popovic, D., Weber, V., Stickler, A., Feller, G., Steurer, P., Yang, J., & Oehler, M. (2024). Grooving & Moving, Blowing & Bowing – Typische Bewegungen beim Saxophonspiel und ihre klanglichen Auswirkungen. Body, Mind & Music, 11–13 April 2024, ÖGfMM & Music Physiology of the mdw, Vienna.
Open demo

MoCap vs. pose tracking vs. RITMO
The direct comparison of methods: professional 3D motion capture (Qualisys) alongside BlazePose and global video analysis. Highly instructive for the question of what webcam-based tracking can really achieve.
Reuter, C. (2024). Audiosignalanalyse, KI und die 96 Ohren der akustischen Kamera. Summer school in musical instrument making (SUMU), Westsächsische Hochschule Zwickau, Markneukirchen campus.
Open demo

SHAPED – the violin in detail
Video layers, hand and body tracking, sound radiation and more than 40 acoustic descriptors in a single interface; individual notes can be compared in a targeted way.
Reuter, C. (2024). Audiosignalanalyse, KI und die 96 Ohren der akustischen Kamera. SUMU, Markneukirchen.
Open demo

HandBoX – hand and body in 2D
Hand and body movement with movement traces, emotion data and audio descriptors in sync, with adjustable before-and-after traces.
Reuter, C. (2024). Audiosignalanalyse, KI und die 96 Ohren der akustischen Kamera. SUMU, Markneukirchen.
Open demo

(E)MOTiVATe
Combines valence-arousal judgements with skin conductance, audio features and AI estimates, comparing two cultural groups in the process.
Kilicci, J., & Reuter, C. (2024). “The tingling sensation on my skin”. Poster, 40th annual conference of the German Society for Music Psychology (DGM), 6–8 September 2024, University of Music and Performing Arts Munich.
Open demo

Sound radiation of the guitar
Interactive 3D model with more than 30 sound descriptors in real time; the fingerboard can be played and the radiation followed through the room.
Reuter, C. (2024). Audiosignalanalyse, KI und die 96 Ohren der akustischen Kamera. SUMU, Markneukirchen.
Open demo

Dance steps: cha-cha-cha
3D motion capture of dance steps with trajectories, velocity and acceleration, in sync with the video.
Reuter, C. (2024). Data Science with Tools from SInES. Science Day Motion Capture: Exploring Bodies in Motion, University of Vienna.
Open demo

Dance steps: boogie
Complex foot movements and their temporal organisation in an interactive display.
Reuter, C. (2024). Data Science with Tools from SInES. Science Day Motion Capture, University of Vienna.
Open demo
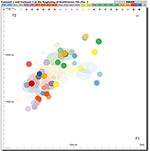
Dynamic Timbre Maps
The formant regions of orchestral instruments as a moving map in the F1-F2 plane – showing how instruments occupy their own sonic territories and hold on to them across pitches.
Open demo
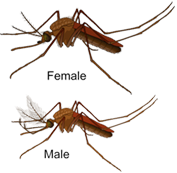
Will this Mosquito Bite me?
Estimates the sex of a mosquito from its wingbeat frequency – only the females bite. An entertaining yet methodologically sound example of applied bioacoustics and a good way into a course.
Open demo
12 · What it is about and how a project proceeds
From recording to analysis in six steps – with the mistakes that happen most often.
The basic principle of all tools: load the file into the application → analyse → save the results on your own computer.
From an audio file (mp3, wav) or a video (mp4), measurable data can be obtained: how bright or rough does a note sound? How does a person move while making music? How does posture change over the course of a piece? How do listeners respond emotionally? That is exactly what the SInES Tools are made for. The results can be saved as CSV, Excel or JavaScript data and processed further in R, Python, SPSS or Excel.
Six steps
- Recording: steady camera on a tripod, good and constant lighting, little occlusion, the person fully within the frame. Set a fixed frame rate if the camera allows it.
- Choosing a tracker: BlazePose for a single person, MoveNet for groups, MediaPipe for hands, Human.js for body, hands and face together.
- Analysing: load the file, check the frame rate, let the pass run through completely.
- Exporting: save CSV, Excel or JavaScript arrays; give files meaningful and consistent names.
- Visualising: load the tracking data together with the video into a data analyzer and check the curves visually (Section 8).
- Analysing statistically: only then calculate means, correlations or models (Section 10 or R).
Common beginners’ mistakes
- Camera held in the hand or with autofocus and automatic white balance – this produces apparent movement and jumps in the landmarks.
- Unknown or fluctuating frame rate: without the correct frame rate, all velocity and acceleration values are scaled incorrectly.
- Stimuli of differing loudness in a listening experiment – then what is measured is level, not timbre.
- Feeding tracking data straight into the statistics without visual inspection.
- Recording several data sources without a common synchronisation signal. A clap at the beginning costs two seconds and saves the analysis.
13 · Quick selection: which tool for which question?
Look for your research question, note the name of the tool and scroll back to the section number given.
How can this sound be described objectively?
Signal Analysis Tool I
Meyda.js, around 50 audio features · Section 1
How bright, rough or sharp does the sound seem?
Spectral Features / Roughness Estimator
Essentia.js; roughness models · Section 1
Which pitches and which tempo?
Pitch & Tempo Analyser
Essentia.js, beat tracking, chords · Section 1
How loud is it really (dB, sone, LUFS)?
dB Analyzer
calibration, weighting filters, loudness models · Section 1
How does the room sound?
Room Acoustics Tool
impulse response according to ISO 3382-1 · Section 1
How does the ear process this sound?
Auditory Image Model (AIM2026)
auditory model after Patterson et al. · Section 1
Which emotion, which genre, which instrument?
CLAP and MusiCNN tools
zero-shot and trained models · Section 2
How do I prepare stimuli properly?
Loudness Normalizer, Spectral Editor
LUFS according to EBU R 128; spectral editing · Section 9
How does a person move?
2D/3D Pose Tracker
BlazePose, 33 landmarks · Section 4
How does a group move?
2D Multiple Person Pose Tracker
MoveNet, up to 6 people · Section 4
What are the hands doing?
2D/3D Hand Tracker
MediaPipe Hands, 21 points per hand · Section 5
How does posture change?
3D Pose Tracking Visualiser
shoulder alignment, neck inclination, trunk inclination · Section 8
How much movement is there in the image at all?
Video Motion Analysis Tool
frame differencing, optical flow, RITMO · Section 6
How can something almost invisible be made visible?
Video Motion Amplification
Eulerian video magnification · Section 6
Which points on the instrument are moving?
Point Tracker
KLT feature tracking with OpenCV.js · Section 6
What does the face show?
Facial Expression Analysis
face-api.js, seven expression classes · Section 5
How does someone experience the music?
Emotion Analysis
valence-arousal, eSense sensors, Meyda.js · Section 7
How does the body respond physiologically?
Heartbeat Tracker / Muse 2 EEG
rPPG via webcam; 4-channel EEG · Section 7
How do I analyse my tracking data?
2D or 3D Data Analyzer
kinematics, smoothing, PCA, export · Section 8
Are movement and sound related?
Time Series Analyser
cross-correlation with lag analysis · Section 10
Do my groups differ?
t-Tester / SupANOVA
t-test with Cohen’s d; ANOVA and PCA · Section 10
Do my raters agree?
Interrater Calculator
Fleiss’ kappa, Krippendorff’s alpha · Section 10
14 · Methodological assessment: strengths, limits, sources of error
What can seriously be said with markerless tracking and browser-based signal analysis – and what cannot.
What these tools can do
- markerless capture from ordinary videos, without a specialised laboratory
- frame-by-frame coordinates in 2D and, in part, in model-based 3D
- derived quantities such as trajectories, joint angles, velocity, acceleration, path length
- roughly 50 to 100 acoustic features per audio file, including psychoacoustic models
- linking video, audio and physiological data on a single time axis
- export in open formats for further analysis in R or Python
What they expressly cannot do
- no measurement of forces, joint moments or inverse dynamics
- no muscle activity – that requires EMG
- no individual anthropometric calibration as in a biomechanics laboratory
- no medical diagnosis and no statement about the risk of injury
- no reliable determination of inner emotions from face or voice
- no absolute sound levels without a calibrated recording chain
Common sources of error
- occlusion by the instrument, a music stand, clothing or other people
- motion blur during fast gestures, especially at a low frame rate
- changing light as well as automatic exposure and white balance correction
- unstable frame rate and heavy video compression
- jumps in landmarks as well as confusion of left and right
- differing coordinate systems and scalings between the tools
Recommendations for your own projects
- The research question comes first, the tool second – not the other way round. A few clearly defined variables are stronger than a large heap of data.
- Before the main recording, always carry out a short test run with an identical set-up and check the quality of the tracking.
- Store raw video, tracking data and analysis separately and under comprehensible names.
- Always check time series visually before calculating means or models.
- With several data sources, define a common time axis and record a synchronisation signal, such as a clap at the beginning.
- Always declare automatically estimated emotion, age or similar person categories as model estimates and reflect on them ethically.
- A simple model with clearly defined, reliably captured variables is usually of more scientific value than an extensive but poorly controlled one.
15 · Computing time and browser
Because the analysis runs on your own device, its performance determines how long that takes.
Background
Pose tracking of ten minutes of video can take half an hour on an older laptop and a few minutes on a current device. Processor, memory and activated graphics acceleration are the decisive factors here; for work with video, 16 GB of RAM is a sensible lower limit. Two minutes of well-chosen material are usually more productive analytically than twenty minutes of raw video – and many times faster.
Tip: use Chrome as your default browser
It is best to open the SInES Tools in Google Chrome. All applications run most reliably there; a few older tools explicitly require Chrome or Firefox, which is noted on the respective tool page.
Also helpful: activate hardware acceleration in the browser settings (TensorFlow.js and MediaPipe use WebGL), close other tabs, connect the device to the mains and keep the tab in the foreground during long runs.
16 · Data security, data protection and research practice
Why these tools can as a rule also be used with sensitive material – and why this cannot be claimed across the board for every application.
With the vast majority of SInES applications your files stay on your own computer – but that cannot be guaranteed across the board.
By far the most tools are HTML pages with JavaScript: the browser loads the program code and, where necessary, an AI model from the network once, after which the analysis runs entirely on your device via the Web Audio API, WebAssembly, WebGL and locally stored model files. A few tools of the SInES lab, by contrast, are not browser apps but Python programs and scripts (such as Hardinator, PADMEA or the Self-similarity Searcher). They too compute locally, but they are installed and executed as software. When in doubt, therefore, check the information given on the respective application page.
“Upload”
In the browser apps the file dialogue as a rule only means that the file is loaded into the memory of your browser. An upload in the proper sense – a transfer to a server – does not take place.
Computing
Audio, video and model computations take place in the browser; the AI models also work on your device. Once you close the tab, the memory is cleared – whatever you want to keep has to be saved beforehand.
“Download”
The download writes the results from the application to a location of your choice on the same computer. Here, too, nothing leaves your machine.
How you can check this yourself: load the application, then disconnect from the network and start the analysis. If it still runs through, no material leaves your device. Bear in mind, however, that calling up the page itself – as with any web access – may generate connection data on the server of the University of Vienna, and that demos may be hosted on external servers.
What this means for research practice
- Personal data remain in your hands. With the locally computing applications, video recordings of students, patients or participants are not transmitted to third parties. This considerably eases ethics applications and GDPR compliance – but responsibility for storage, access and deletion periods still rests with you.
- No account, no registration, no usage profiles.
- Usable offline. Once the page and its models have been loaded, the analysis also works without a network connection – practical for fieldwork and for talks without stable Wi-Fi.
- However: In an ethics application or a data protection statement you should not describe the processing as “purely local” across the board, but check the specific application you are using and name it explicitly.
To be clarified before recording
- Written consent from the people recorded, with a clear statement of purpose, place of storage, access and deletion period.
- Separate storage of raw video and analysed data; for sharing, the coordinate or feature files are usually sufficient, not the video.
- Sensors such as eSense or Muse connect to the device via Bluetooth – here too the data stay local, but the pairing has to be permitted.
- Automatically estimated categories such as emotion, gender or age are model estimates and must be labelled as such – they are not a measurement of a person.
17 · Your own projects and the Motion-Emotion-Lab
How you can work with these tools at the mdw.
The Motion-Emotion-Lab of the mdw is a partner of the SInES Tools for empirical music research at the University of Vienna. We use the tools in teaching, in final theses and in research projects on music physiology, instrumental posture, performance tension and musical expression.
The quickest way in is a short test run with your own material: two minutes of video are enough to see whether the tracking quality is sufficient for your question. For questions about study design, calibration, synchronisation or analysis in R, please get in touch with the lab.
Demo audio for valence-arousal tracking
For a first test run with the application Emotion Analysis (Section 7) a prepared audio mix is available.
Download the demo mp3
Typical starter projects
- Comparison of posture before and after a teaching intervention (Pose Tracker + 3D Data Analyzer)
- Bowing and the resulting sound (Hand Tracker + Signal Analysis + Time Series Analyser)
- The course of performance tension (Heartbeat Tracker or eSense + Progression Charter)
- Ensemble synchrony in rehearsal and concert (MoveNet + Video Motion Analysis)
- Room acoustics of practice rooms and their effect on practising (Room Acoustics Tool)
18 · Citation, licence and acknowledgements
Scientific tools should be cited – the tool as much as the method behind it.
Citing a single tool
The author and the year are given at the bottom of each application.
Reuter, C. (2021). SInES Tools: Audio Signal Analysis Tool I [Web application]. https://sinestools.univie.ac.at/meyda_signalanalyse.htm
Citing the SInES Tools as a whole
Reuter, C., Czedik-Eysenberg, I., Cui, A.-X., Ambros, S., Klooss, F., Feller, G., Schachner, I., Roos, M., Lindenbauer, H., Li, H., & Bertsch, M. (2026). SInES Tools, Helpers, Visualizers as your Scientific Realizers. In Fortschritte der Akustik – DAGA 2026, 52. Jahrestagung für Akustik (pp. 1002–1005). Dresden: Deutsche Gesellschaft für Akustik.
The underlying methods
In the methods section, describe not only the tool you used but also the method behind it (BlazePose, MediaPipe, Meyda.js, Essentia.js, CREPE, CLAP, for example) and cite its original source – you will find it on the respective English application page. The methods section should additionally contain: model name and version, frame rate, window size and hop size of the audio analysis, the smoothing used together with its parameters, and how missing values were handled.
Licence and acknowledgements
SInES Tools © 2019–2026 by Christoph Reuter and SInES, released under the MIT licence. Warm thanks to Christoph Reuter and the SInES team of the University of Vienna for developing these tools and making them freely available.
19 · References from the SInES lab
Exclusively work by the SInES team of the University of Vienna and its collaborations in which these tools were developed, tested or applied. The original sources of the underlying methods (BlazePose, Meyda.js, CREPE, Eulerian video magnification and so on) are given on the respective English application page. The complete list of publications can be found at sines.univie.ac.at/research/publications.
Czedik-Eysenberg, I., & Reuter, C. (2023). Harder than (a) rock – Evaluierung der Rolle perkussiver Komponenten der Begleitstimme für den Härteeindruck von Musikstücken. In Fortschritte der Akustik – DAGA 2023, 49. Deutsche Jahrestagung für Akustik (pp. 927–929). Hamburg.
Czedik-Eysenberg, I., & Reuter, C. (2025). Evaluating timbre-related audio descriptors across different libraries and multimodal embeddings. In Proceedings of the Joint Conference DAS|DAGA 2025, 51st Annual Conference on Acoustics (pp. 171–174). Copenhagen.
Czedik-Eysenberg, I., Roos, M., Weber, V., Klooss, F., Cui, A.-X., Reuter, C., & Oehler, M. (2023). Play it again, Sam(ple) – Trends in the prevalence of repetition and audio self-similarity in German chart songs [Poster]. 17th International Conference on Music Perception and Cognition (ICMPC17) & 7th Conference of APSCOM (p. 224). Tokyo.
Czedik-Eysenberg, I., Smialek, E., & Herbst, J.-P. (2024). Towards an acoustic-semantic space of extreme metal vocal styles. In Fortschritte der Akustik – DAGA 2024, 50. Deutsche Jahrestagung für Akustik (pp. 979–982). Hannover.
Czedik-Eysenberg, I., Wieczorek, O., Flexer, A., & Reuter, C. (2024). Charting the universe of metal music lyrics and analyzing their relation to perceived audio hardness. Transactions of the International Society for Music Information Retrieval, 7(1). https://doi.org/10.5334/tismir.182
Reuter, C., Bertsch, M., Czedik-Eysenberg, I., Cui, A.-X., Roos, M., Ambros, S., Jewanski, J., Eder, M., Mühlhans, J., Klooss, F., Popovic, D., Weber, V., Stickler, A., Feller, G., Steurer, P., Yang, J., & Oehler, M. (2024). Grooving & moving, blowing & bowing – Typische Bewegungen beim Musizieren [Lecture/demo]. University of Vienna.
Reuter, C., Czedik-Eysenberg, I., & Cui, A.-X. (2023). Happy life comes with P5 – P5, ML5, Meyda and Plotly as helpful tools in teaching and research. In Fortschritte der Akustik – DAGA 2023, 49. Deutsche Jahrestagung für Akustik (pp. 991–994). Hamburg.
Reuter, C., Czedik-Eysenberg, I., & Cui, A.-X. (2023). Moves & Grooves. Analyse von Audiosignalen, Tracking von Körper, Hand und Gesicht/Ausdruck. OCG Journal, 48(4), 20–23.
Reuter, C., Czedik-Eysenberg, I., Cui, A.-X., Ambros, S., Klooss, F., Feller, G., Schachner, I., Roos, M., Lindenbauer, H., Li, H., & Bertsch, M. (2026). SInES Tools, Helpers, Visualizers as your Scientific Realizers. In Fortschritte der Akustik – DAGA 2026, 52. Jahrestagung für Akustik (pp. 1002–1005). Dresden. https://sinestools.univie.ac.at/SInES_Tools_2026.pdf
Reuter, C., Czedik-Eysenberg, I., Cui, A.-X., Roos, M., Ambros, S., Eder, M., Yang, J., & Bertsch, M. (2025). Sciene shines with SInES – SInES Tools for audio and video analysis, new updates and improvements. In Proceedings of the Joint Conference DAS|DAGA 2025, 51st Annual Conference on Acoustics (pp. 183–186). Copenhagen.
Reuter, C., Schmid, C., Yang, X., & Yang, J. (2025). I see something you can only hear – Visualising musical performance with SInES tools and sonic cam. In Proceedings of the Joint Conference DAS|DAGA 2025, 51st Annual Conference on Acoustics (pp. 168–170). Copenhagen.
About this page
Editorial orientation for study, teaching and research at the Motion-Emotion-Lab of the mdw. The authoritative sources are the original English pages of the SInES Tools, maintained by SInES at the University of Vienna; scope, names and versions may change there at any time.
To the English SInES Tools page →
Editor: Matthias Bertsch, Motion-Emotion-Lab of the mdw – University of Music and Performing Arts Vienna.
Version: July 2026 · Based on the SInES Tools overview with 112 applications · Questions and corrections are welcome at the lab.